Precision agriculture has promised for decades to transform farming from a practice guided primarily by experience and intuition into one grounded in spatially explicit, temporally current data. That promise is only now being fulfilled at scale, largely because the sensor delivery mechanisms needed to make field-level data collection operationally practical have finally reached the price points and usability levels that mid-size commercial farming operations can sustain. Commercial UAVs are the primary mechanism driving that change.
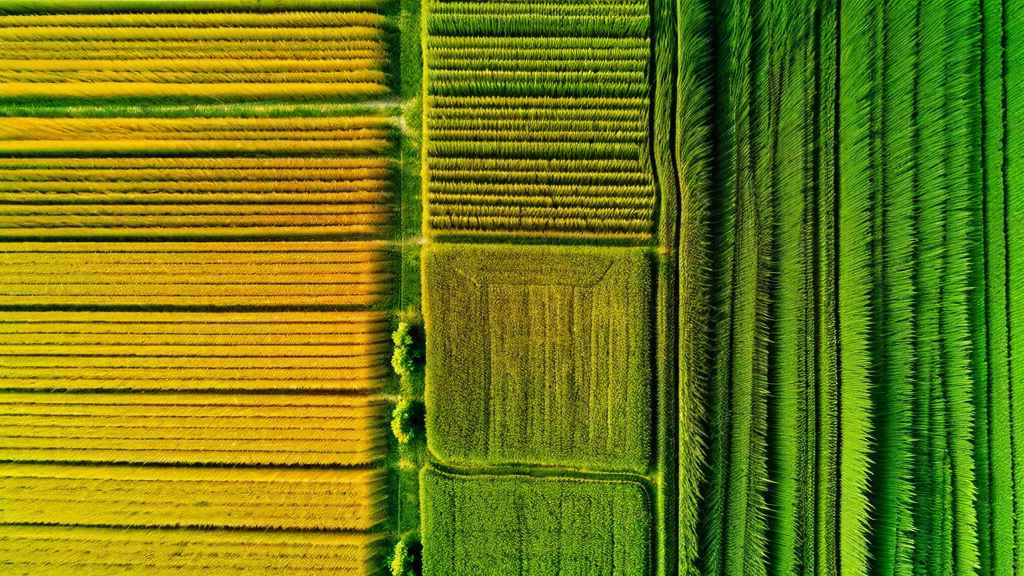
The fundamental value proposition is straightforward. Crop fields are not uniform. Soil texture, organic matter content, drainage characteristics, pH, and nutrient levels vary across fields in patterns that determine how crops establish, grow, and respond to inputs. Managing these non-uniform fields with uniform prescriptions — applying the same seed rate, fertilizer rate, and irrigation depth across the entire field — is economically wasteful and agronomically suboptimal. Fields managed with spatially variable prescriptions — applying more where conditions support higher yield potential and less where they do not — consistently outperform uniform-management controls on both yield and input efficiency metrics.
Multispectral Imaging and Vegetation Indices
The normalized difference vegetation index (NDVI) is the starting point for most drone-based crop monitoring programs, and understanding why it works is important for interpreting its outputs correctly. Green vegetation absorbs red-wavelength light strongly for use in photosynthesis and reflects near-infrared radiation strongly — a reflectance pattern that is fundamentally different from soil, water, or stressed/dead vegetation. NDVI exploits this difference by computing the ratio of near-infrared minus red to near-infrared plus red, producing a value between -1 and +1 where higher values indicate more vigorous live vegetation.
The agronomic utility of NDVI derives from its correlation with chlorophyll content, which is in turn correlated with nitrogen status, water status, and photosynthetic rate. A field with spatially variable NDVI is telling you that some areas are functioning more effectively as photosynthetic systems than others, but NDVI alone does not tell you why. The diagnostic value increases substantially when NDVI maps are combined with historical yield maps, soil survey data, and in-season weather and irrigation records — allowing agronomists to test hypotheses about the causes of spatial variability and design targeted interventions.
Red-edge reflectance indices complement NDVI by providing stronger sensitivity to early-stage chlorosis — the yellowing associated with nitrogen or iron deficiency — before it reaches levels visible to NDVI. Multispectral sensors with a red-edge band (typically centered around 720 to 740 nanometers) enable earlier deficiency detection and provide a cleaner signal in dense canopies where NDVI saturates. Most commercial precision agriculture UAV programs now use five-band multispectral cameras that capture blue, green, red, red-edge, and near-infrared bands, providing the spectral information needed to calculate NDVI, NDRE (normalized difference red-edge index), and the chlorophyll index simultaneously.
Crop Scouting and Disease Detection
Traditional crop scouting — a trained agronomist walking transects through a field to visually assess crop condition, pest presence, and disease — is time-consuming and spatially limited. A thorough manual scout of a 100-hectare field takes four to eight hours, and the number of fields a single agronomist can monitor in a season is physically constrained. This creates coverage limitations that mean significant sections of many commercial farms receive only cursory monitoring, particularly at critical growth stages when the window for intervention is narrow.
Drone-based crop monitoring changes the coverage equation fundamentally. A multispectral survey of a 100-hectare field takes 25 to 40 minutes of flight time, and the resulting data covers the entire field uniformly rather than the sample points accessible by foot. Processing the imagery through vegetation index analysis identifies the specific zones within the field where stress indicators are elevated, directing manual scouting effort to the areas of highest concern rather than requiring systematic coverage of the entire field.
Disease detection from multispectral imagery is more challenging than nutrient deficiency monitoring because many foliar diseases produce reflectance changes that are similar to water stress or nutrient deficiency in early stages. High-resolution RGB imagery captured simultaneously with multispectral data adds a visual identification dimension that, combined with spectral indicators, substantially improves diagnostic specificity. Commercial programs that combine trained agronomist review of both RGB and multispectral outputs achieve disease detection rates comparable to manual field scouting, with earlier detection timing in most cases.
Variable-Rate Prescription Generation
The agricultural value of drone-based monitoring is most fully realized when sensor data is used to generate variable-rate application prescriptions — spatially variable recipes for seeding, fertilization, irrigation, or crop protection that are loaded into precision application equipment and executed automatically. This closes the loop from observation to action, converting the analytical insights from drone surveys into measurable changes in input distribution across the field.
Variable-rate nitrogen prescriptions are the highest-value application in most grain cropping systems. In-season drone NDVI surveys at stem extension or early flag-leaf growth stages correlate well with nitrogen status, allowing agronomists to calculate zone-specific top-dress nitrogen prescriptions that correct deficiencies in under-performing zones while avoiding over-application in zones where crop nitrogen status is adequate. Published trials of drone-guided variable-rate nitrogen programs in wheat and corn show average input reductions of 12 to 18% compared to uniform-rate programs with yield maintenance or improvement, implying cost savings of $25 to $60 per hectare.
Variable-rate seeding prescriptions are typically generated from multi-year yield map analysis and soil survey data rather than in-season drone imagery, but drone-captured stand counts at early crop establishment stages provide a valuable calibration and verification layer. High-resolution RGB imagery captured at the two-to-three-leaf stage enables automated stand count analysis — counting individual plants in the image — that confirms whether seeded populations have established correctly and identifies zones where replanting may be warranted.
Irrigation Management and Thermal Imaging
Thermal imaging from UAVs provides a water stress indicator that is fundamentally different from and complementary to spectral vegetation indices. Canopy temperature — the thermal emission temperature of the crop surface — rises when stomata close in response to water deficit, because transpirational cooling is reduced. A thermally imaging drone can detect the canopy temperature difference between well-watered and water-stressed crop zones, identifying the spatial pattern of water stress across a field before it reaches the severity level that causes yield loss.
For irrigated crops under center-pivot or linear-move irrigation systems, thermal mapping identifies spatial non-uniformity in water delivery — zones receiving inadequate application due to nozzle failure, pressure differential, or system design limitations — that is difficult to quantify by inspection of the irrigation equipment alone. Correcting these non-uniformities based on thermal map evidence typically recovers yield in previously under-watered zones while identifying areas where water application can be reduced without penalty.
Canopy temperature data combined with evapotranspiration models enables crop water use calculation at field scale — a parameter that is essential for managing irrigation scheduling in water-limited production systems. As agricultural water regulation tightens in many production regions, the ability to document crop water use patterns with drone thermal data is becoming increasingly valuable for regulatory compliance as well as operational efficiency.
Soil and Field Mapping
High-resolution orthomosaic imagery from drone RGB surveys captures surface features that correlate with soil characteristics — topographic variation, drainage pattern expression, historical crop variation visible in bare soil spectral differences — that complement and refine conventional soil survey mapping. In areas where soil survey data is coarse or outdated, drone-derived surface morphology maps provide a cost-effective basis for identifying soil management zones that can be validated with targeted soil sampling.
Emergence mapping — capturing plant establishment density shortly after planting — provides an immediate indicator of seed germination performance, soil compaction issues, or herbicide damage that would not be detectable from yield maps until harvest. This early-season diagnostic capability allows agronomists to intervene during the growing season when corrective action is still possible, rather than retrospectively analyzing yield variation after the season is complete.
Key Takeaways
- Five-band multispectral sensors (blue, green, red, red-edge, NIR) provide NDVI, NDRE, and chlorophyll index simultaneously, enabling better early-stage stress detection than three-band alternatives.
- Drone-based surveys cover 100 hectares in 25–40 minutes, directing manual scouting effort to the highest-concern zones rather than requiring full-field walking coverage.
- Variable-rate nitrogen programs guided by in-season drone NDVI surveys reduce nitrogen inputs 12–18% with yield maintenance, saving $25–$60 per hectare.
- Thermal imaging detects canopy water stress before it causes yield loss, and identifies spatial irrigation non-uniformity in center-pivot systems.
- Emergence mapping in early establishment provides in-season diagnostic information that allows corrective action before the growing season is complete.
- Combining RGB and multispectral outputs with agronomist review achieves disease detection rates comparable to manual scouting with earlier timing.
Conclusion
Precision agriculture's potential to improve both economic and environmental performance of commercial farming operations has been constrained for two decades by the difficulty and cost of generating the spatially explicit crop and soil data that precision management requires. Commercial UAV platforms with multispectral, thermal, and high-resolution RGB imaging capability have removed that constraint for a growing segment of the agricultural market.
The farms that will capture the full value of this transition are those that integrate drone-captured data into a broader agronomic decision framework — combining sensor outputs with soil maps, historical yield data, and trained agronomic interpretation to generate spatially targeted prescriptions and measure their outcomes. Drone surveys are the sensing layer of a precision agriculture system, not the complete solution. Operators who treat them as such consistently deliver better results than those who use drone maps as standalone diagnostic tools without the supporting data infrastructure.